
Describing Graphs & Charts Activities, Games & Worksheets
Charting Success
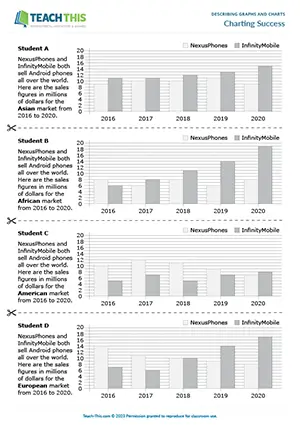
Business English Describing Charts and Trends Activity - Writing, Listening and Speaking: Table Completion, Summarising, Freer Practice - Group Work
In this productive describing charts and trends activity, students describe sales figures and trends in bar charts. First, in groups, each student completes a table on...
Trend Tracker
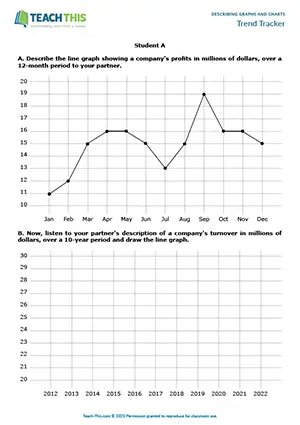
Business English Describing Graphs Activity - Speaking: Describing, Drawing, Controlled and Freer Practice - Pair Work
In this free describing graphs and trends speaking activity, students describe and draw trends in a line graph. In pairs, Student A begins by describing a line graph showing a company's profits in millions...
Trend Terminology
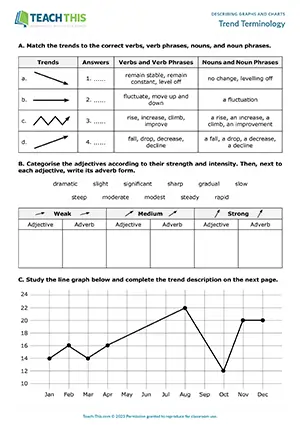
Business English Describing Trends Worksheet - Vocabulary, Reading and Writing Exercises: Matching, Categorising, Gap-fill, Writing a Paragraph
In this useful describing trends worksheet, students practice verbs, nouns, adjectives and adverbs that describe trends. Students begin by matching symbols that...
Bar Chart Dominoes

Business English Describing Bar Charts Game - Vocabulary: Matching - Pair Work
In this describing bar charts game, students use a picture to match dominoes together and form a description of a bar chart and its trend. The first player looks at the...
Describing Graphs and Charts
Describing graphs and charts involves identifying what the data measures, reporting relevant figures and explaining patterns or changes. Students need to connect numbers with accurate language so listeners can understand the main message without confusing the size, direction or timing of a change.
This page contains four resources across B1 and B2, including a worksheet, speaking activities and a dominoes game, with one free activity.
The table shows useful language with hypothetical figures. These examples illustrate descriptions rather than report actual business results.
| Description focus | Purpose | Example language |
|---|---|---|
| Introduce the data | Identify the measure and period shown. | 'The graph shows monthly sales in millions of dollars from January to June.' |
| Describe an increase | State an upward movement and its starting and ending values. | 'Sales rose from $10 million to $12 million.' |
| Describe a decrease | Report a fall using a verb or a noun phrase. | 'Sales fell sharply' or 'There was a sharp fall in sales.' |
| Describe stability | Show that a value changed little or not at all. | 'Sales remained stable at around $12 million.' |
| Compare values | Identify a relevant difference between categories. | 'Sales in Region A were higher than in Region B.' |
| Summarise the pattern | Bring together the overall movement without listing every figure. | 'Overall, sales increased despite a brief decline in April.' |
How to Describe Graphs and Charts
Establish the measure and scale: Check the labels, units and time period before describing a pattern. Sales, profits and turnover are not interchangeable, and a figure in millions needs to be reported with the correct unit.
Select the main pattern and supporting figures: Give an overview, then use relevant values or comparisons to illustrate it. Reserve words such as 'sharply' for changes that justify that description in the context of the scale and period shown.
Separate observation from explanation: A graph may show that sales increased, but it does not necessarily show why. Describe the visible change accurately and use additional evidence before attributing it to advertising, pricing or another cause.
3-Step Framework for Teaching Graph and Chart Descriptions
The first two B1 stages use different parts of one chart-information activity. The final stage is a separate B2 extension for students ready to work with more detailed descriptions.
1. Exchange Figures Accurately: Students transfer sales figures from their bar charts into tables, then describe the charts to group members who record the numbers. This gives the descriptions a clear listening purpose and makes the accuracy of figures, periods and units important.
2. Turn Figures into an Overview: Using the collected information, students write sentences describing each company's regional sales trends and the overall global trend. They compare their sentences within the group. This moves the focus from individual values to selecting and communicating a broader pattern.
3. Check Descriptions Against the Chart: In the B2 extension, pairs use a bar chart to connect sentence parts on dominoes. Each addition must fit both the language and the trend shown. This provides further practice checking whether a description matches the visual evidence, rather than accepting a sentence only because it sounds grammatical.
Common Mistakes with Graph and Chart Descriptions
Confusing by and to: Use by for the amount of change and to for the final value. For a rise from $10 million to $12 million, Incorrect: 'Sales rose by $12 million.' Correct: 'Sales rose by $2 million to $12 million.'
Mixing adjective and adverb forms: Use an adverb to modify a trend verb and an adjective to modify a trend noun. Incorrect: 'Sales fell sharp.' Correct: 'Sales fell sharply' or 'There was a sharp fall in sales.'
Common Questions About Teaching Graph and Chart Descriptions
What free activity helps students practice describing graphs?
The activity Trend Tracker has students describe a line graph while their partner listens and draws it. They then swap roles with a different graph and compare the completed drawings with the originals. This gives students a concrete way to check whether their descriptions communicate figures, time periods and changes accurately.
What worksheet helps teach language for describing trends?
The worksheet Trend Terminology introduces verbs and nouns for trend directions, along with adjectives and adverbs for describing changes. Students categorise language, form adverbs and complete a description of a sales graph. They then write about a second graph, applying the language to describe its trends in their own paragraph.
Become a Teach This Member
Get unlimited access to the full library, plus new resources added every week.
Unlimited Resource Access
Download from 3000+ worksheets, activities, and games.
Save 5+ Hours Weekly
Cut lesson prep time with ready-to-use resources, plus teacher notes and answer keys.
Trusted Professional Quality
Classroom-tested, editable resources created by experienced ESL professionals.
Fresh Content Weekly
Get 5 new resources added to the library each week.
Here's what our members are saying...


